The HerdOptix dashboard
Your herd records.
A clearer daily view.
HerdOptix turns DairyComp herd data into a dashboard for production, reproduction, and health, with additional context from EZFeed and MilkMoovement.
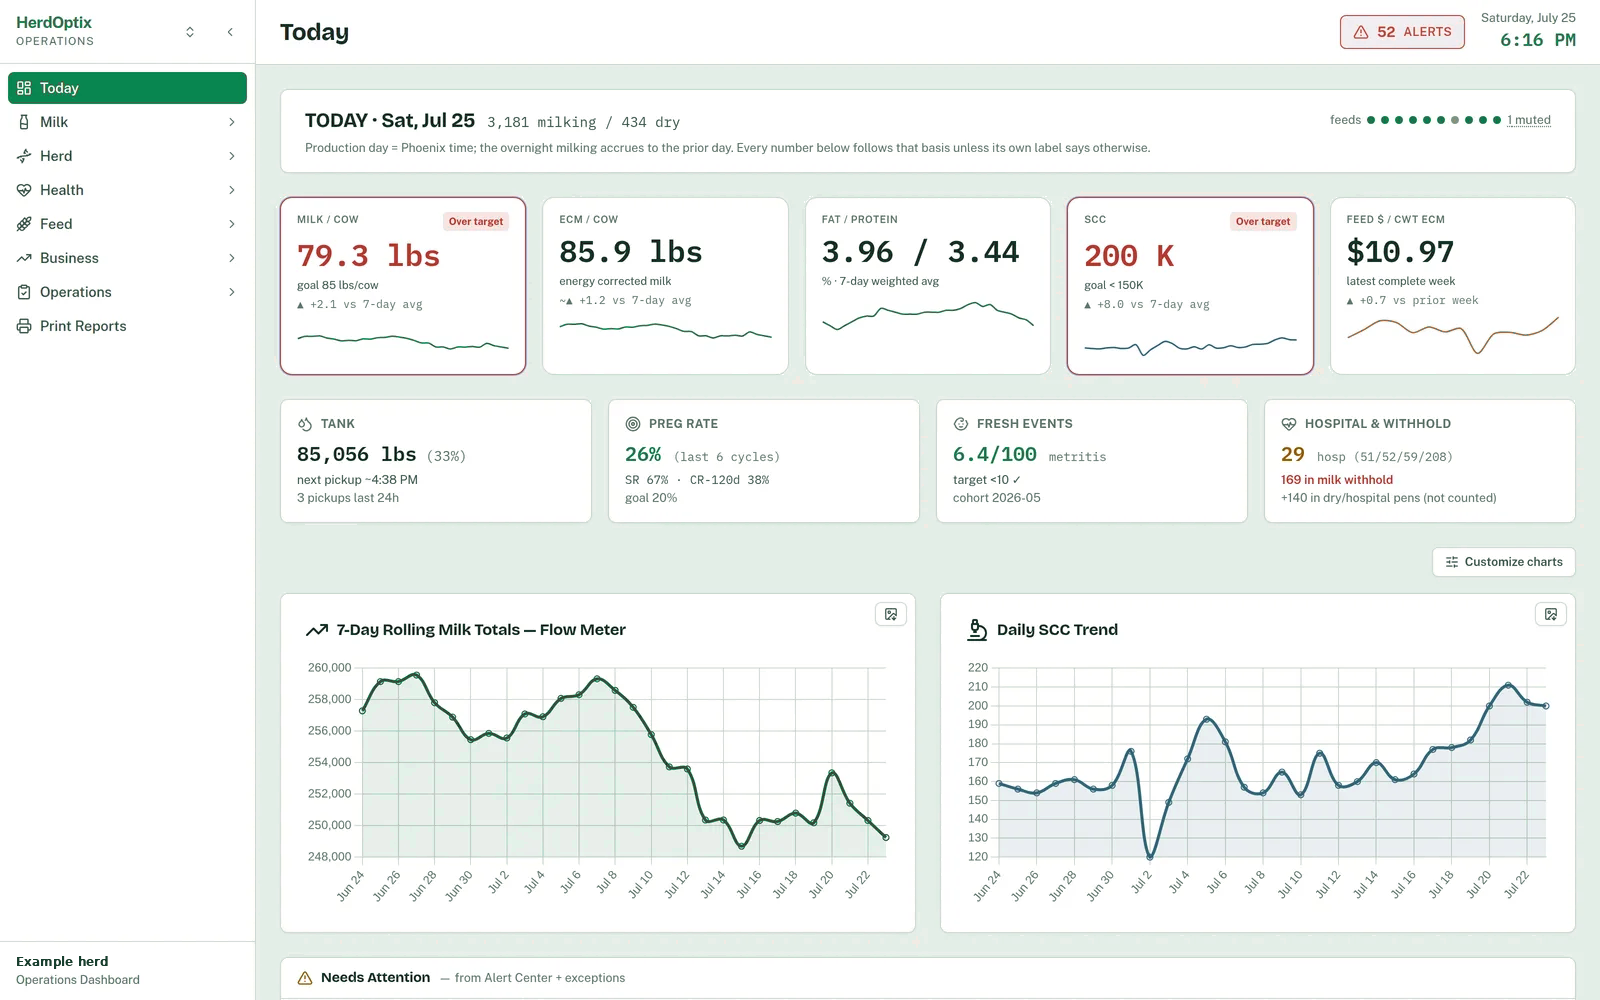
Your daily herd dashboard
A daily view of milk, breeding, and health measures. See what changed, then open the trends and records behind it.
- Milk per cow, components, somatic cell count, and recent trends
- Pregnancy-rate and fresh-cow health measures alongside production
- Feed-cost context from the available feeding records
- Source and reporting-period context for your review
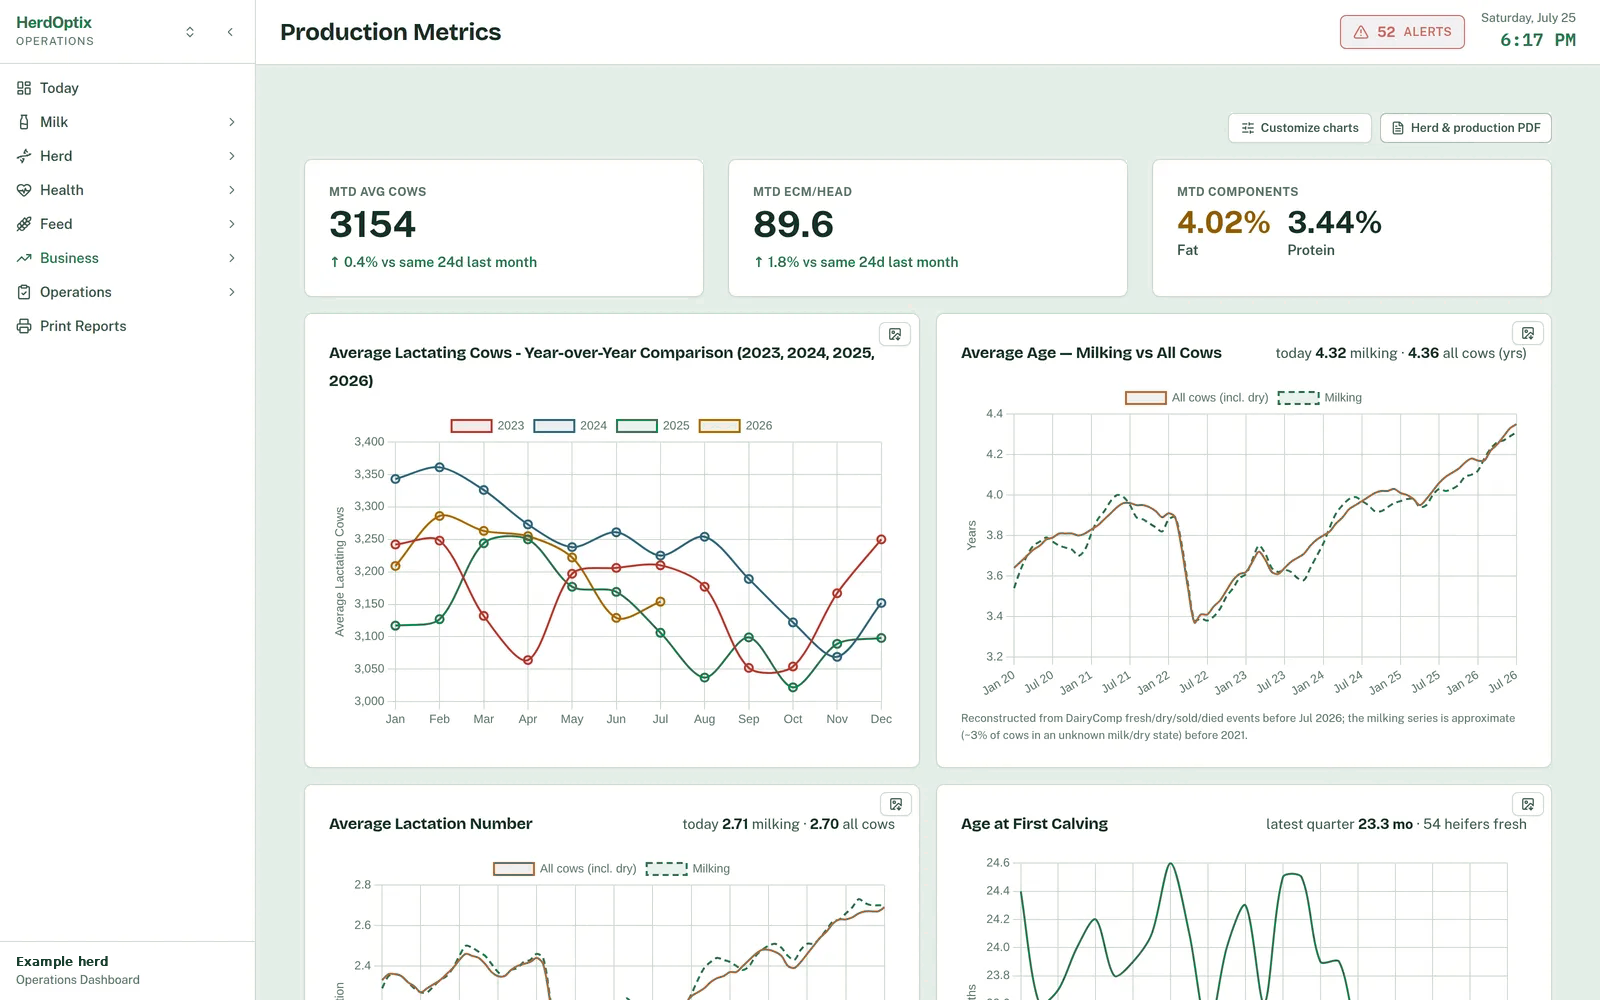
Production over time
Read production alongside herd size, days in milk, milk components, and feeding records. Compare periods before investigating a change.
- Milk and energy-corrected milk trends
- Year-over-year production comparisons
- MilkMoovement pickup and milk-quality records
- EZFeed records for feeding and cost context
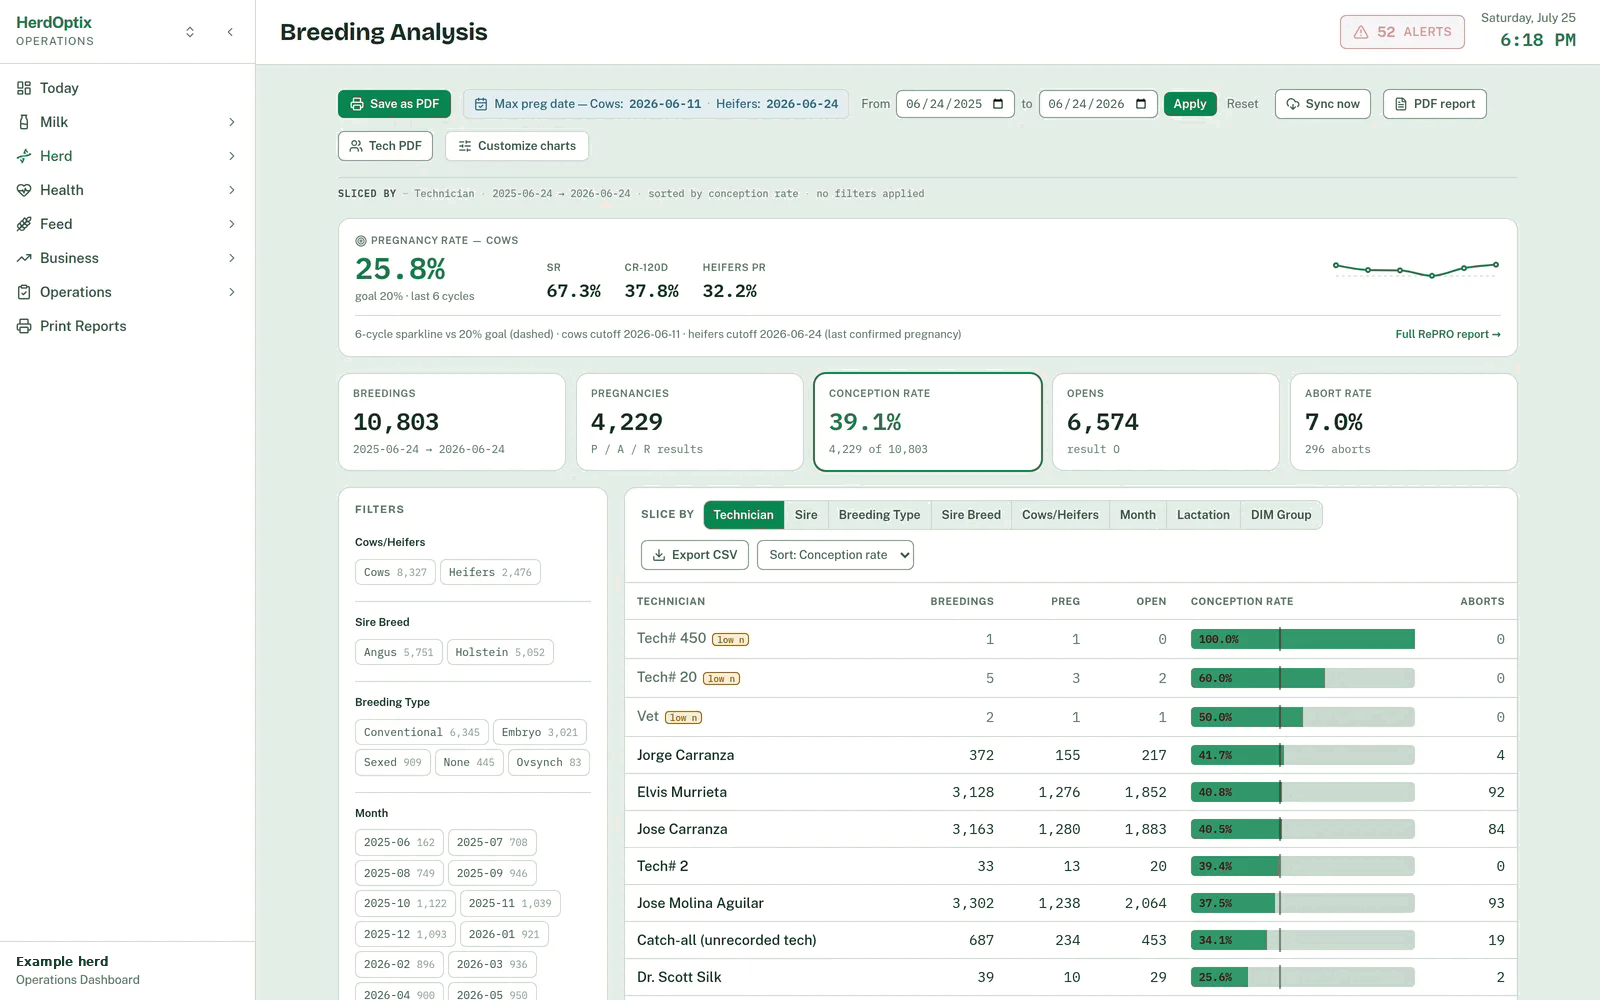
Reproduction from your herd records
Use DairyComp breeding records to understand pregnancy, service, and conception rates, then compare the groups behind the numbers.
- Pregnancy and service rates by breeding cycle
- Conception analysis by sire, technician, lactation, and days in milk
- Cow and heifer breeding results
- Calving and dry-off planning from herd records
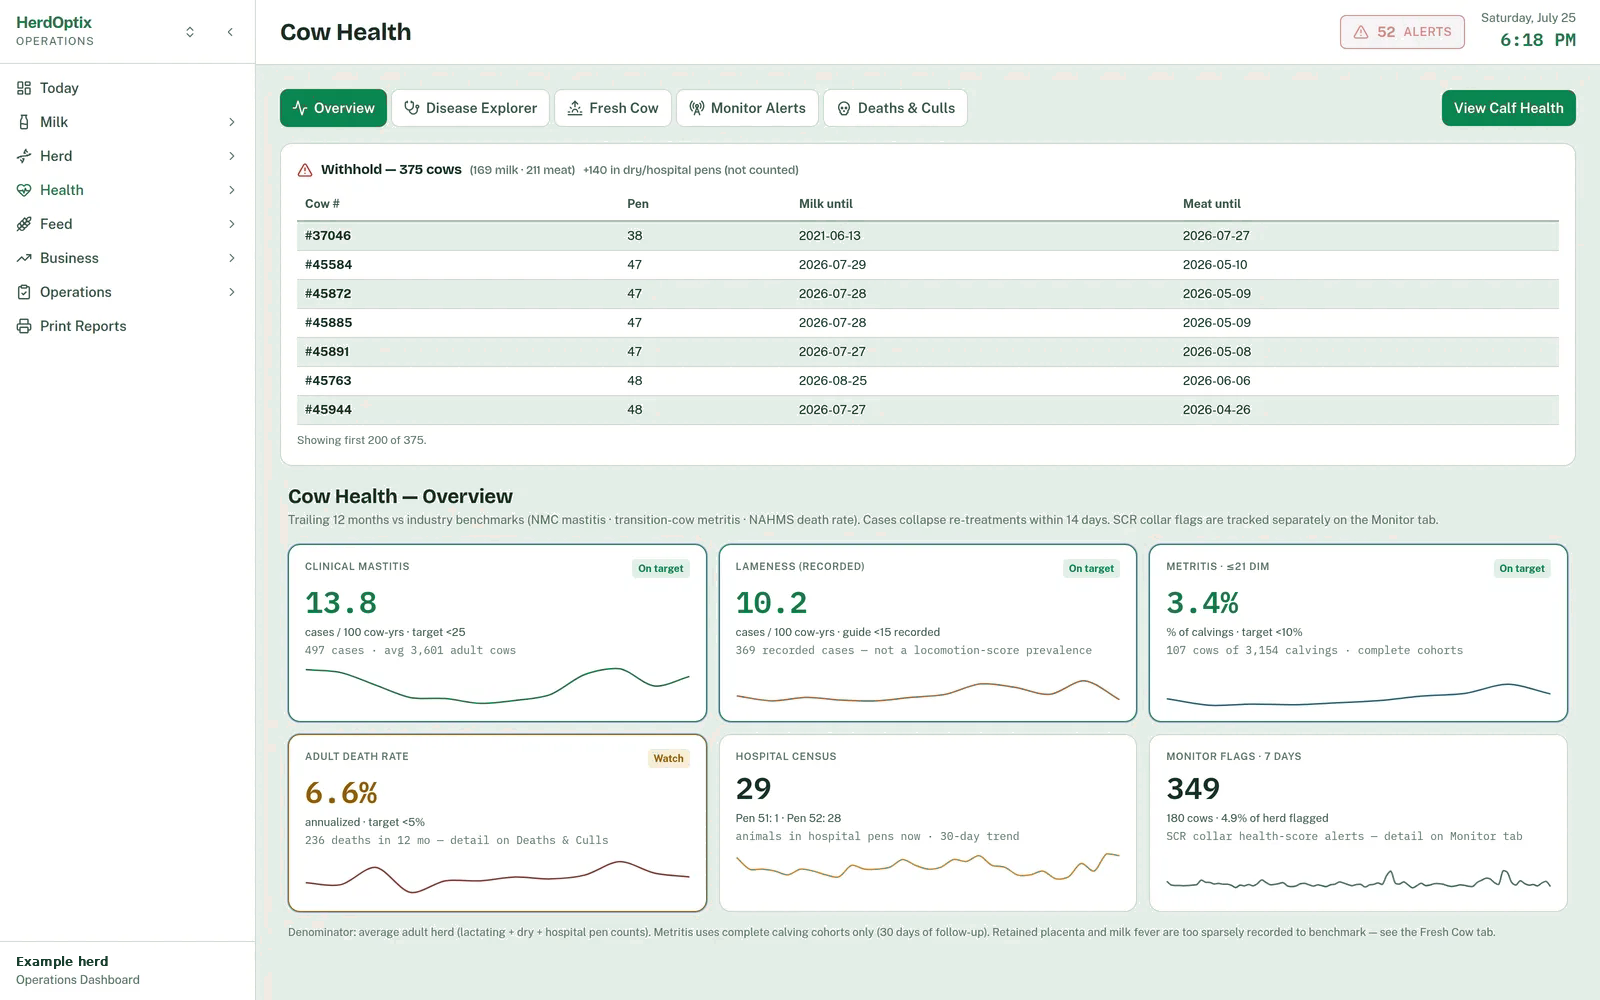
Herd health in context
Follow recorded health events through the herd. Compare lactations and stages of production to see where cases are concentrated.
- Mastitis, lameness, metritis, and death-loss measures
- Disease analysis by lactation and days in milk
- Transition-cow and calf-health trends
- Reports for your next herd-manager or veterinarian review
What would you like to see in your dashboard?
Tell us about your herd records and the systems you use. We’re open to connecting more platforms and data types.